Although there are speed efficiencies that can be achieved by successfully digitizing the enterprise, the competitive advantages will be gained by achieving a new level of process understanding that can be leveraged to produce at a higher quality, in a shorter time, and at a lower cost.
In a regulated industry like life sciences, an improved process understanding will help speed up license applications and maintain compliance during ongoing manufacturing.
In most settings, a qualitative/semi-quantitative process understanding exists. Through extensive experimentation and knowledge transfer, subject-matter experts (SMEs) know a generally acceptable range for distinct process parameters which is used to define the safe operating bounds of a process.
In special cases, using bivariate analysis, SMEs understand how a small number of variables (no more than five) will interact to influence outputs.
Quantitative process understanding can be achieved through a holistic analysis of all process data gathered throughout the product lifecycle, from process design and development, through qualification and engineering runs, and routine manufacturing.
Data comes from time series process sensors, laboratory logbooks, batch production records, raw material COAs, and lab databases containing results of the offline analysis.
As a process SME, the first reaction to a dataset this complex is that any analysis should be left to those with a deep understanding of machine learning and all the other big data buzzwords. However, this is the ideal opportunity for multivariate data analysis (MVDA).
In the pharmaceutical industry, MVDA is already being used to establish new, faster, data-driven workflows to solve existing problems. Some of those applications include:
- Faster investigations. Perform data-driven RCAs by throwing in all the data from a batch to narrow process variables of interest
- Comparing process data of recently completed batches to historically good and bad batches to predict quality long before lab results are available
- Monitoring how a batch is performing in real-time and performing corrective actions when trajectory becomes poor
- Enhancing, and eventually replacing, offline lab testing by developing models for characterization made possible with Process Analytical Technologies (PAT)
- Perform ongoing cluster analysis to enhance a Continuous Process Verification (CPV) program and display proficiency to regulatory agencies
What is multivariate data analysis (MVDA)?
MVDA is a set of statistical techniques that can help users comb through a dataset with many parameters, think process sensors, or tests conducted over the course of a batch.
The objective is to identify those variables that are responsible for most of the variability. With the right tools, the analysis and interpretation of results are such that a statistical background is not required.
The significant upside and low cost of entry make MVDA an ideal starting point for those who have been collecting data but don’t know how to begin extracting value.
MVDA can be used in industrial manufacturing to drive any number of business objectives including:
- Increasing overall productivity by identifying causes of poor performance
- Avoid/reduce waste by identifying root causes
- Faster investigations and RCA – quickly determine what is the cause of deviations
Legacy manufacturing has typically been limited to univariate analysis. This is time-consuming and fails to capture interactions between dependent variables. Key outcomes are driven by multiple variables simultaneously – if not, all operations would be optimized.
On the other extreme of algorithm complexity is Machine Learning (ML). Internet giants have been leveraging these techniques (and large amounts of data) to achieve step-change improvements in tasks previously done by humans.
The size of batch manufacturing data sets is a key impediment to achieving the same level of success with ML algorithms designed for big data.
Analytics workflow with a modern MVDA solution
MVDA is the ideal middle ground between algorithm complexity and the value of the findings. For industrial manufacturers, an implementation of MVDA may look something like this:
- Gather historical process data (sensors, input/output characteristics, numeric/non-numeric – very few limitations) around a segment of the process with unexplained variability in performance
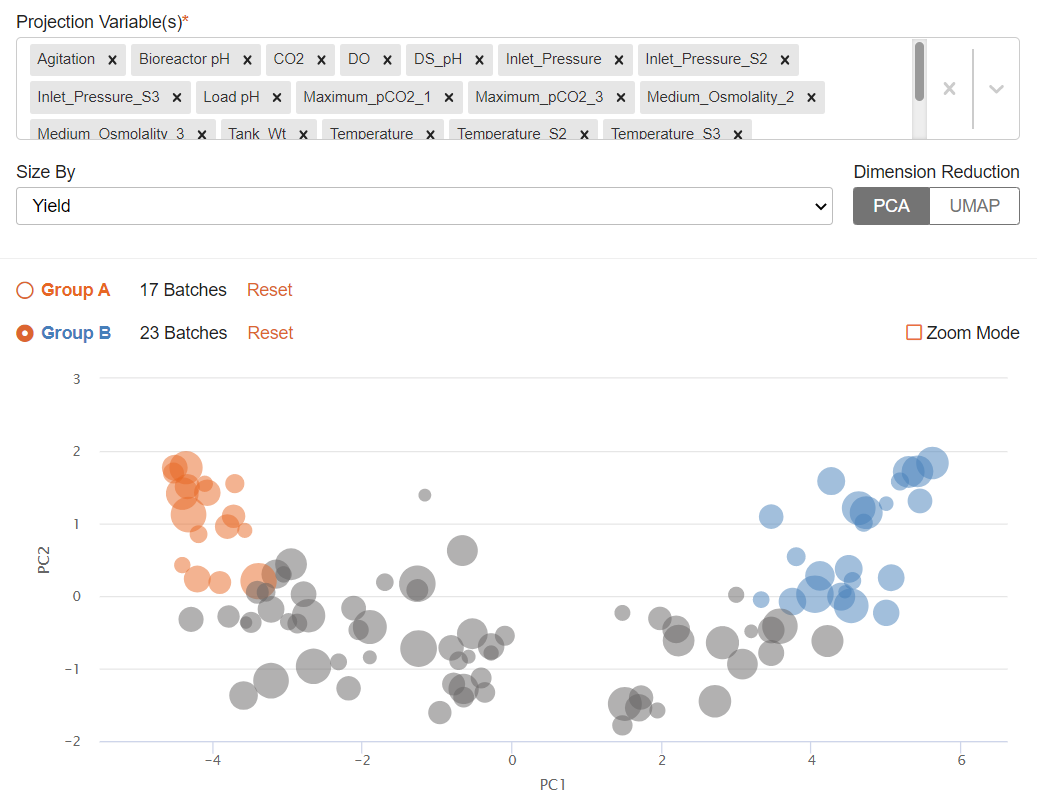
- Use an MVDA tool to visually compare the data for each group. This is the power of the technique; reduce the number of parameters to a 2-dimensional graph and determine group similarity by proximity. In the image below, entities in group A are more like each other than the entities in group B, simply due to proximity.

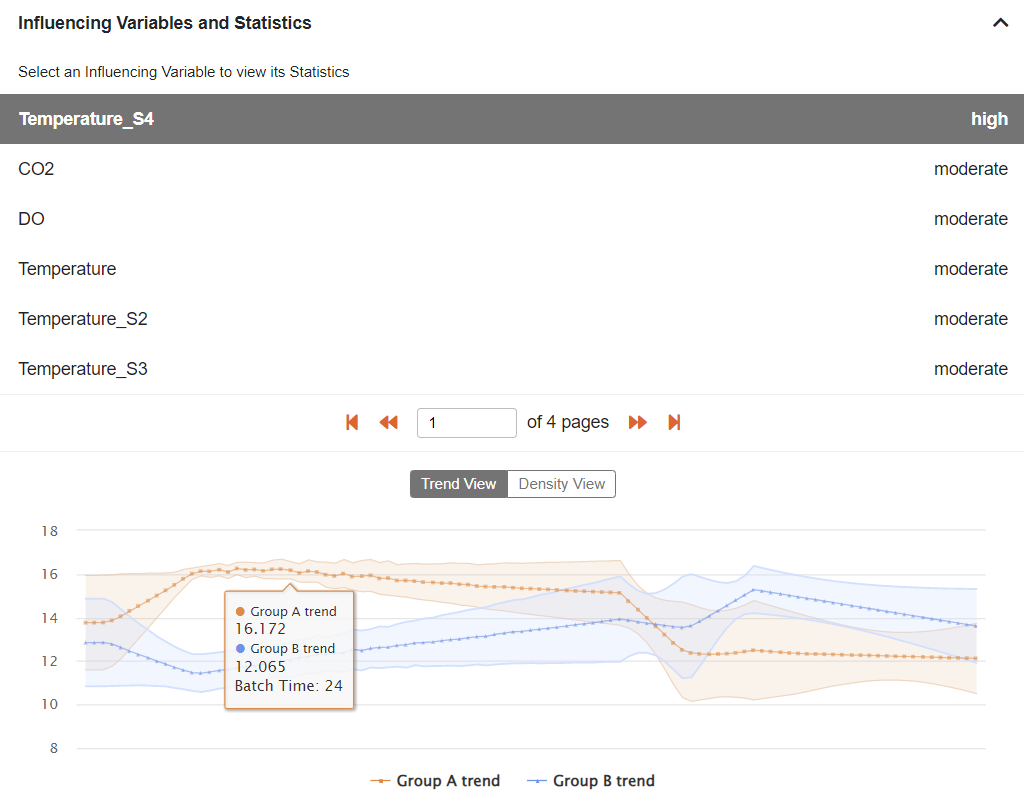
- Use the MVDA tool to extract a list of the original process parameters, ranked by their impact on the difference in proximity between the two groups

- Prioritize those controllable process parameters near the top of the list for any process improvement initiatives
In the above example, Principal Component Analysis (PCA) was used to perform an unsupervised analysis. Two groups were formed in the example, but this is not mandatory; the leftover batches (grey dots) can be selected and compared to either of the original groups.
The user may begin the analysis with little understanding of the dataset and an open question. In the end, they have performed multidimensional scaling to reduce many relevant process variables to the select few that are most responsible for the issue motivating the analysis.
The value of this analysis is not limited to those historical batches in the original dataset. In an enterprise setting where there are hundreds of use cases like the one described above, each one a different process unit with many associated variables, these types of solutions must be scalable.
With the right MVDA tool, the model resulting from an ad-hoc investigation can be turned into an automated monitoring system. Data for newly completed batches can be automatically incorporated and compared against the defined clusters without needing to repeat any modeling or analysis.
A finding that once would have been confined to a report and become legacy knowledge can now be deployed for all personnel to be aware of how ongoing batches perform with respect to any metric.
The Quartic MVDA solution is the right tool for both new and experienced practitioners. For those new to MVDA, the Quartic solution eliminates the customization overload made available in other workbench solutions, leaving users with the easiest workflow that will deliver the bulk of insights.
For experienced practitioners, the Quartic solution coupled with the Quartic platform offers a seamless way to build, maintain, and deploy models. No more scrambling with multiple tools to extract and prepare data, migrating to a separate tool for MVDA, and then being left with a static model for which the entire process needs to be repeated each time new data becomes available.
Industrial Case Study
A pharmaceutical company is experiencing yield variability in the fermentation step of a key product. The data sources for this step include time-series process data from a historian, quality, and yield data from a LIMS database, raw material lot information from paper records, and batch context information from a batch execution system.
The laboratory results are the primary indicators of process performance. As such, although the operation lasts 5 days, SMEs don’t have any indication of the outcome until 2 to 3 weeks later when lab results are available. By this time other batches have been manufactured or are in progress; any process changes thought to improve the outcome are being significantly delayed.
Finally, analysts supporting this process conduct investigations on an ad-hoc basis. They are performing many manual steps to navigate legacy tools to perform the necessary data preparation steps only to execute static univariate comparisons.
During a pilot, the Quartic MVDA application was deployed. With this solution the process SMEs themselves were able to analyze the data. All data preparation was taken care of following an upload of separate time series and discrete data sets.
Through a PCA following similar steps to those previously discussed, the SMEs were able to quickly identify 3 process variables behaving differently between high and low-yield batches.
In subsequent efforts, the team integrated the Quartic Platform and the Quartic Process Optimization application. Using the former, live connections were established to the data sources.
Not only did SMEs no longer have to upload data, but the streaming process data also permitted a real-time comparison between the active batch and historical good batches and a prediction of trajectory for the remainder of the batch.
With the Optimization application, users have presented setpoint recommendations to correct the course of a batch deviating from optimal performance.
To learn more about Quartic.ai’s MVDA application or to book a demo visit: https://www.quartic.ai/applications/mvda/